

COVID is now on the rise across almost the whole of the Winchester district.
Twelve out of 14 areas have seen an increase, according to the most recent published figures. The numbers for Winchester are rising faster than across Hampshire as a whole.
This is the first time any increases have been across the board since the winter. The sharpest rises are Winchester West, Winchester North and Sparsholt and Alresford.
The number of coronavirus cases in Winchester increased by 56 in the last 24 hours, official figures show – but the death reported on Friday has now been removed bringing the death toll back to 178, the same figure since March 2. The reason for the adjustment is unclear.
A total of 7,865 people had been confirmed as testing positive for Covid-19 in Winchester when the UK coronavirus daily dashboard was updated this afternoon, up from 7,809 on Sunday.
Across the district Covid was rising in 12 areas, with the fastest rises in the city. The figures are the number of cases in the week to Sunday August 18, compared to the week before: Winchester West, 46 cases, up 20 (77 per cent), 361.5 per 100,000; Winchester East, 28, up four (17 per cent) 343.7; Winchester Central/South, 44, up four (47 per cent), 400.1; Stanmore, 29, up 13 (81 per cent) 427.6; Winchester North and Sparsholt, 24, up 10, (71 per cent), 247.3 per 100,000; Oliver's Battery and Hursley, 21, up four (23 per cent), 256.8; Colden Common and Twyford, 28, up nine (47 per cent) 293.9; Springvale and Itchen Abbas, 16, up three (23 per cent), 232.7; Bishop's Waltham and Waltham Chase, 41, up 16 (64 per cent) 423.8; Alresford, 17, up seven, (70 per cent), 200.9; Swanmore, Hambledon and West Meon, 19, up one (6 per cent), 218.2; Whiteley Knowle and Wickham, 31, up two, (7 per cent), 264.8.
District-wide in the seven days to August 19 there had been 388 cases, up from 329 in the previous seven days. Out of 315 local authorities Winchester is now 156th, one of its lowest positions.
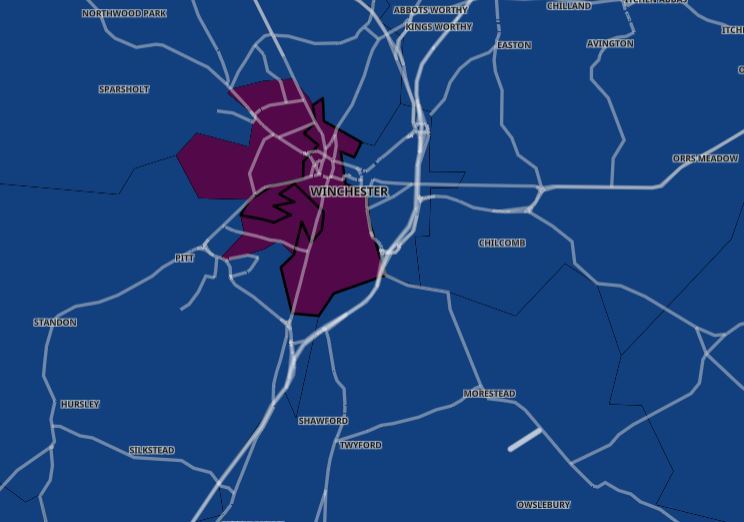
The latest Government Covid map, showing three areas in maroon for more than 400 cases per 100,000: Winchester West, Stanmore and Winchester Central/South
The only decline was Denmead and Southwick, 32, down 20 (38 per cent), 312.0.
For the second day there was no change in South Wonston, Sutton Scotney and Micheldever, 16, 272.2.
The figures also show that more than three-quarters of people in Winchester have received two doses of a Covid-19 vaccine.
The latest figures show 85,666 people had received both jabs by August 12 (Sunday) – 78.9 per cent of those aged 18 and over, based on the number of people on the National Immunisation Management Service database. Some 87.7 per cent have had one dose.


Comments: Our rules
We want our comments to be a lively and valuable part of our community - a place where readers can debate and engage with the most important local issues. The ability to comment on our stories is a privilege, not a right, however, and that privilege may be withdrawn if it is abused or misused.
Please report any comments that break our rules.
Read the rules hereLast Updated:
Report this comment Cancel